
Powerful core capabilities
Terria features
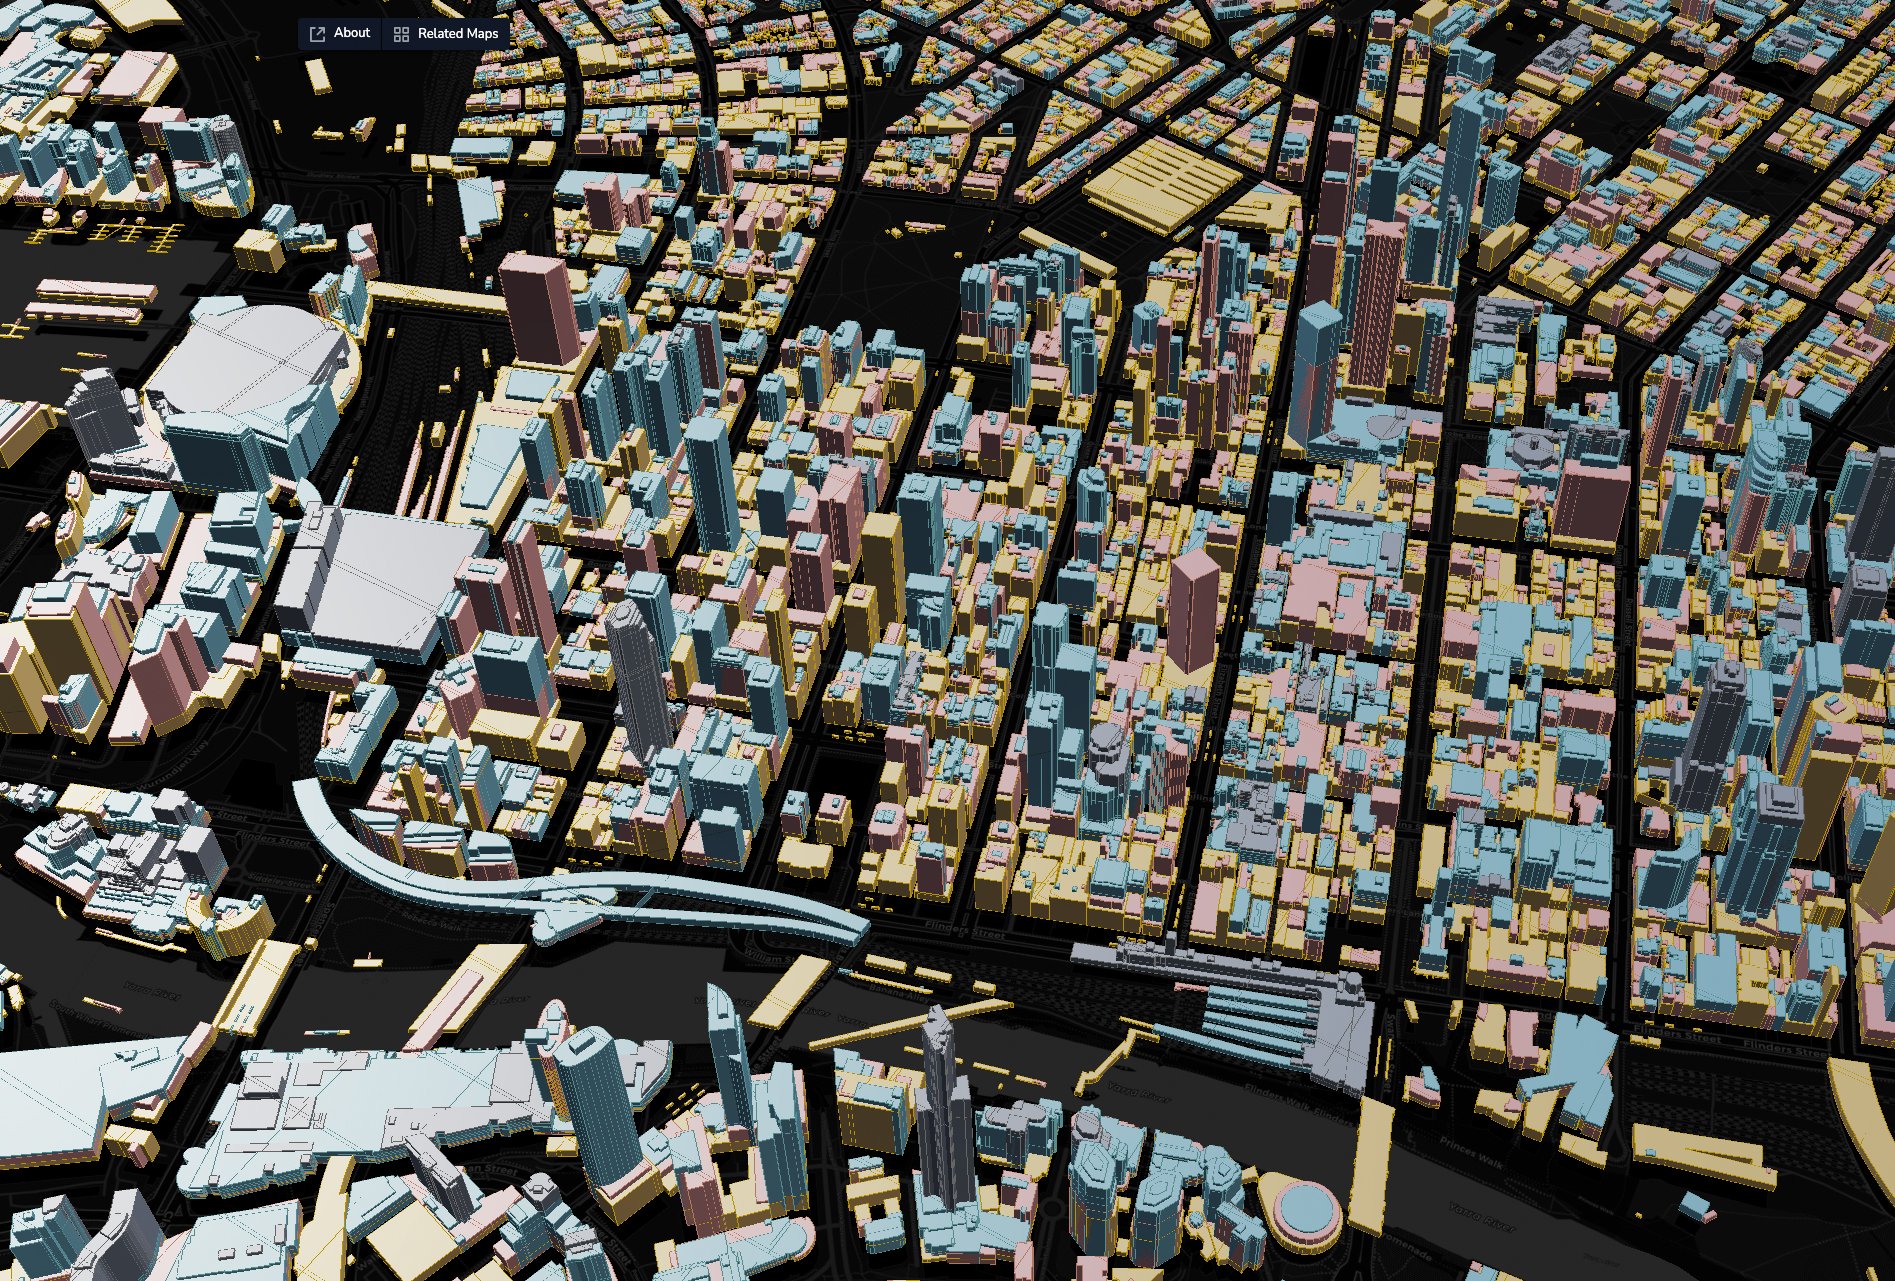
3D and 4D visualisation
See your data come to life in 3D terrain or switch seamlessly to 2D as needed.
Time-series support
Track changes over time with interactive maps and dynamic data layers.

Geoprocessing
Allow your users to specify Web Processing Service (WPS) parameters from the UI and visualise the result in your workbench.

Data stories
Craft and share interactive, engaging data stories directly from your maps. Bring your data to life with narrative-driven visuals that make insights easy to understand and share.

Comparison tools
Easily compare datasets to see differences over time or across locations.

Live data catalogues
Present a dynamic catalogue for existing WMS, ArcGIS, CKAN, CSW, Socrata, WMTS of WFS server, curate the catalogue by hand, or use any combination thereof.

Automatic region mapping
Quickly visualise your data with a simple drag-and-drop. Upload a CSV of region names and values, and TerriaJS will automatically map your data onto the visualisation.

Change detection
Analyse satellite imagery over time to detect and visualise changes in any area. Identify shifts and trends effortlessly, making it easy to monitor and respond to evolving landscapes.

Charting
Easily analyse the underlying data from map features or external sources, using rich and interactive charts, and export the results.

Geospatial formats
Out-of-the-box support for a wide range of formats, including WMS, WMTS, GeoJSON, CSV, and more, making it easy to visualize diverse data sources seamlessly.

Intuitive, responsive UI
Experience a sleek, React-based interface designed by UX professionals for seamless use across phones, tablets, and desktops, ensuring an optimal experience on any device.

Scene editor
Easily integrate and edit your own 3D data in glTF format directly within Terria. This powerful tool is available to all users, enhancing your visualisations with custom 3D elements.

Take your spatial project to the next dimension
See how teams like yours are building digital twins that engage stakeholders and accelerate decisions.